.avif)


Apocalypse to Coping: Data Shows the 3 Stages of COVID Consumer Search Behavior
First we searched for TP, then sourdough starters, then booze. Pattern's ecommerce data shows how 2020 has directly affected consumer searching habits.
Toilet paper, sourdough starters, disposable masks, oh my! It’s been a wild nine months—or nine years (as far as we can tell)—as we’ve settled into the “new normal” of the COVID-19 pandemic, and one particularly interesting story of 2020 is found in what we’ve been buying. From panic purchases to impulse splurges, 2020 has rollercoastered our shopping habits, and the resulting trends are a fascinating glimpse into consumer psychology during the pandemic.
We’ve tracked search-tied purchases over the past nine months to determine what consumers were buying on Amazon at each point of COVID-19. The results can be divided into three main shopping phases: the apocalypse phase, the boredom buying phase, and the comfort buying phase. Here’s what we’ve learned. Note: The following data has been normalized with a mean of 100 to more easily and completely showcase results.
1. The Apocalypse Phase
The first few weeks of COVID-19 lockdowns felt a bit like the Hunger Games as we raced to the grocery store to fight our neighbors for emergency supplies. Uncertainty about the new virus paired with existential dread drove us to make many apocalyptic purchases in March, including food supplies, cleaning products, medicine, disinfectants, and masks. By the end of the month, handsoap was the endangered species of aisle 10 and civil wars were being waged over toilet paper in aisle 12.
For a brief period in March, “bulk” was one of the hottest search items. The number of bulk food purchases rocketed 500% YoY as consumers stocked up their supplies and prepared for the worst. Bulk purchases, in fact, had their best year on record due to pandemic panic purchasing (say that five times fast).
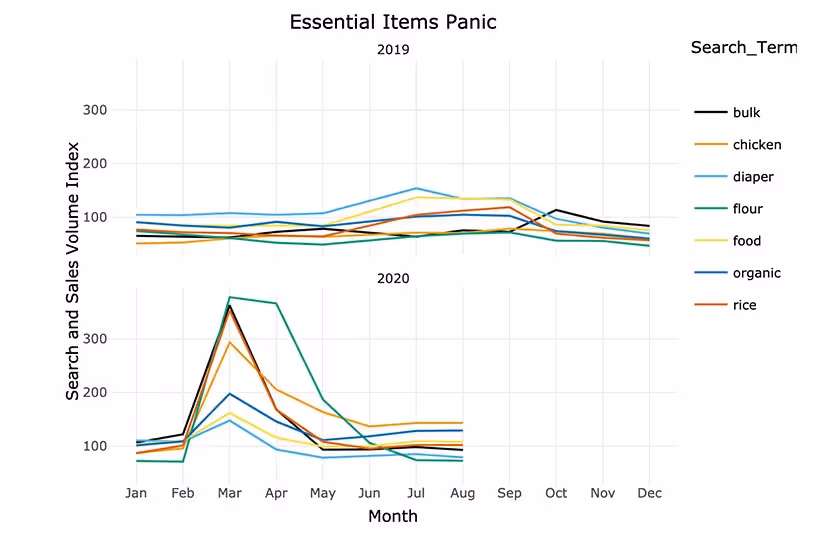
Chicken, rice, and flour were in high demand in March, and flour saw sustained demand through April before falling off again due to limited supplies. As consumers scrambled for non-perishable goods, we saw ramen sales increase 550% and soup sales increase over 750% YoY in March. Some of the clearest spikes are seen in sanitation and hygiene products. More detailed CDC health guidelines led to increased demand for hand sanitizer and soap in February and March. That demand has remained elevated throughout the pandemic, and cleaning products have followed suit.
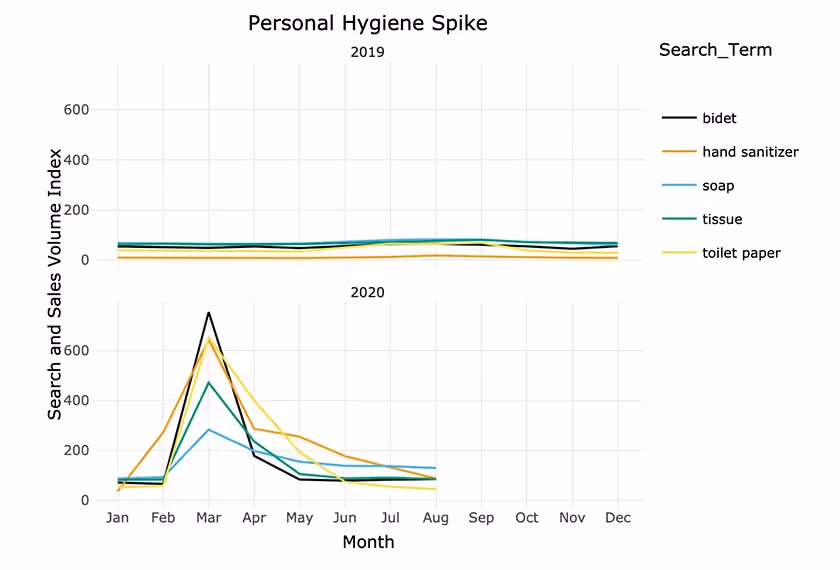
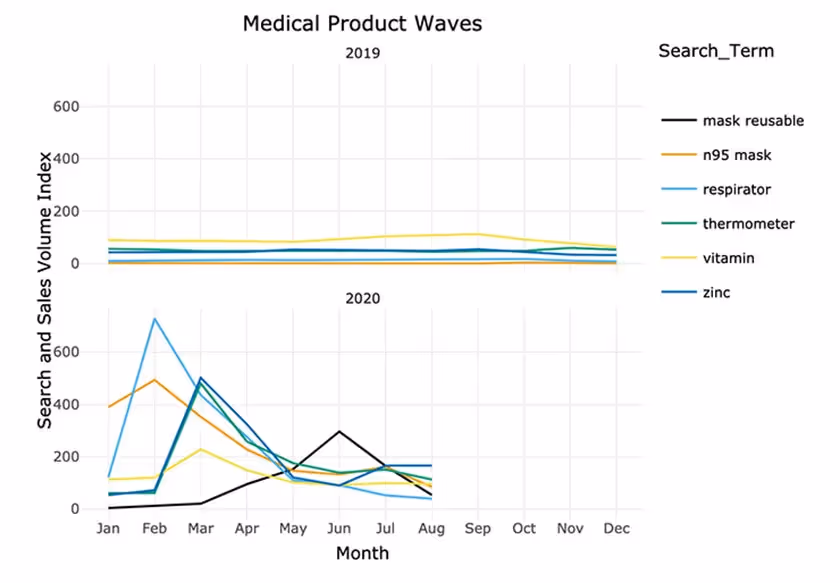
A perhaps unexpected champion in the hygiene department is the bidet. The great toilet paper famine of early-2020 led to a whopping 1500% increase in demand for bidets in March. Thankfully, toilet paper numbers have returned to their former greatness and the demand for TP is back to pre-COVID numbers. Mask purchases have had their own interesting journey during COVID-19.
When so little was known about COVID-19 in January and February, respirators and N95 masks were in high demand. As these items went out of stock and medical specialists had increasing need for them, sales dropped off. Customers instead turned their attention to vitamins, thermometers, and zinc. Come May and June, as unprecedented times became a little more precedented and mask-wearing was the new normal, the demand for reusable masks increased.
2. The Boredom Buying Phase
Once the initial panic purchase phase of COVID-19 wore off and consumers were sheltering in place, we entered the next phase of COVID-19: Now what? Luggage and travel-related purchases were almost completely grounded in March and April as travel restrictions increased worldwide. Fresh on the heels of writing their New Year’s resolutions, consumers also abandoned luxury exercise purchases like fitbits and keto purchases. Sales for all of these products have dived below 2019 numbers and have not yet recovered.
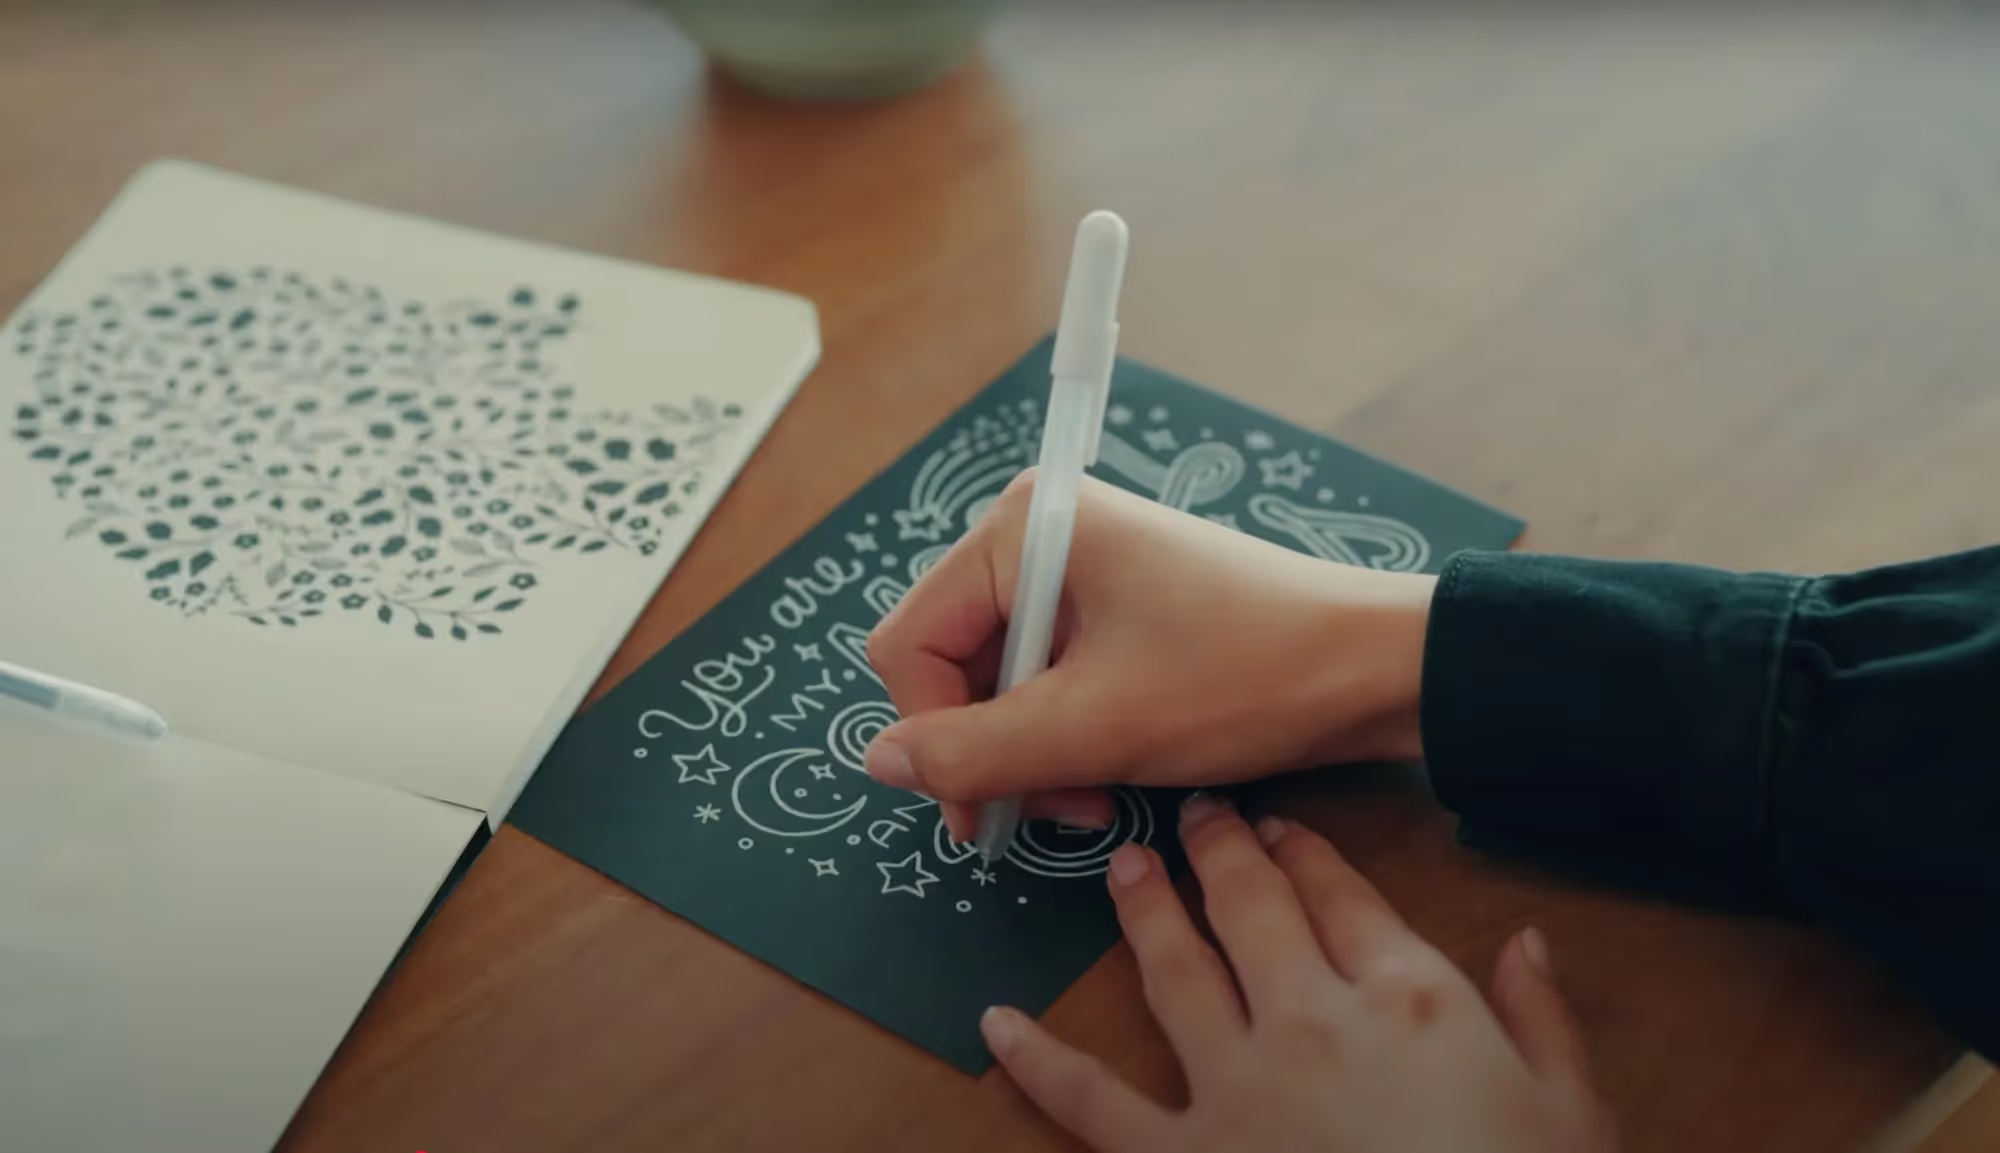
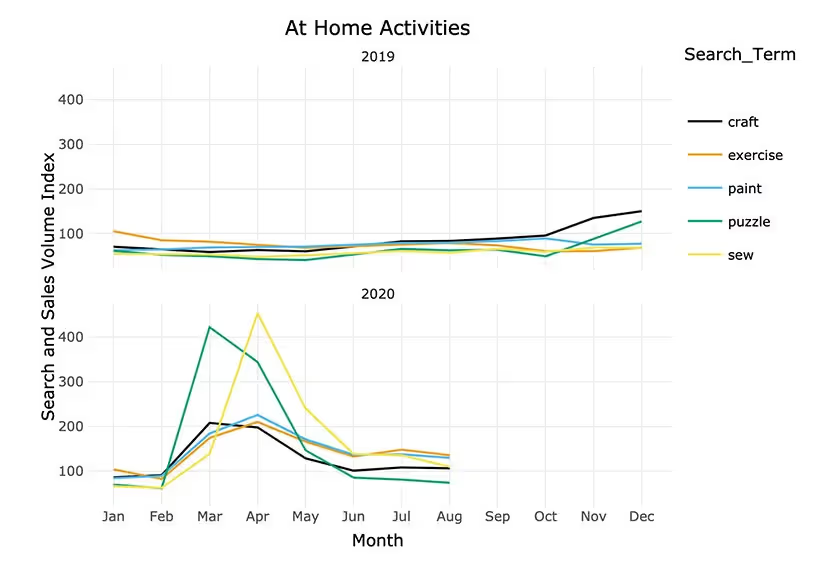
Without trips, sporting events, and parties to keep consumers preoccupied during lockdown (and without expendable funds for luxury goods), consumers looked to beat back onsetting cabin fever in more traditional ways and the demand for inexpensive at-home activities and hobbies soared. Puzzles had their greatest month ever with a growth rate of almost 800% YoY. Sewing, painting, and craft purchases also spiked as consumers got sick of their screens and looked to try new things.
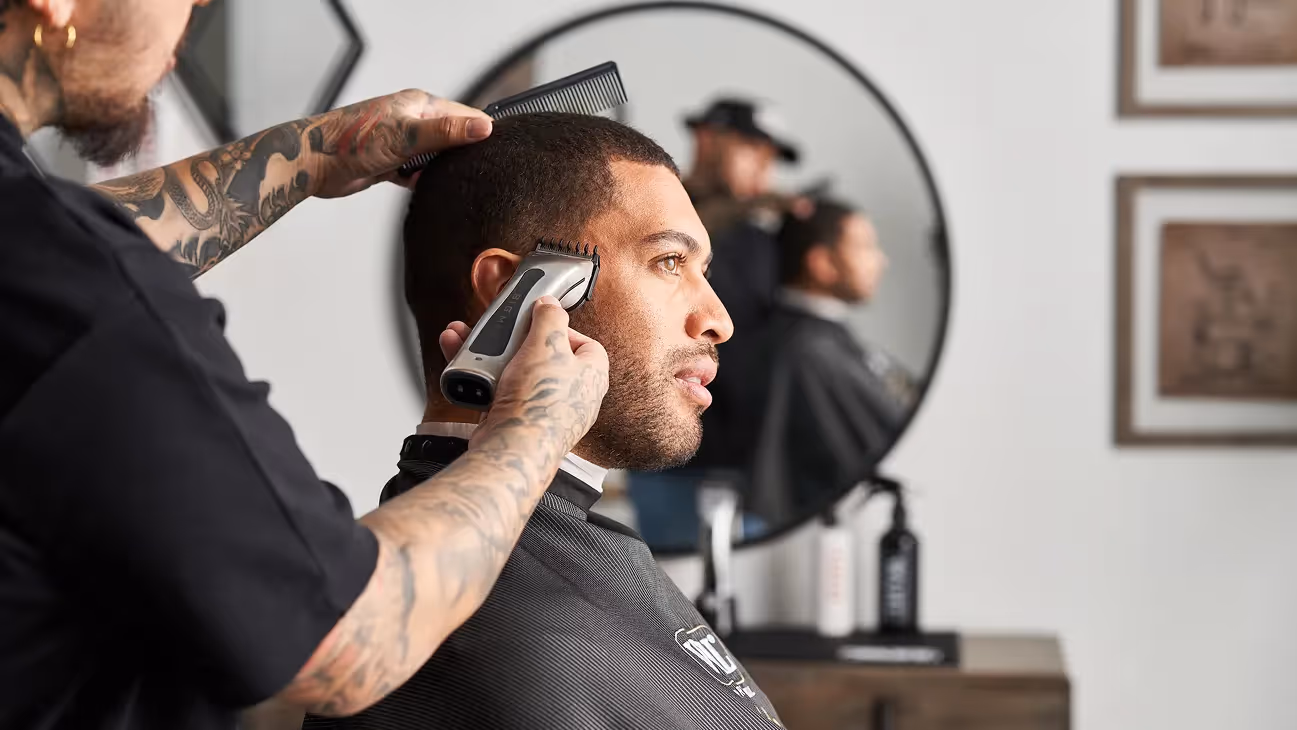
Remember the high demand for flour back in March and April? It might be due (in part) to the fact that everyone and their dog began nursing sourdough starters with all that extra time on their hands—sourdough purchases increased over 700% in April! Without hairdressers available to chop those unruly quarantine locks or retouch those roots, purchases of hair clippers and hair dye increased over 400% in April. Many of those were YOLO purchases as people took to shaving their heads en masse for the heck of it during lockdown. We can’t calculate how many people cut their own bangs out of boredom with this data set, but we can presume that many who did instantly regretted it.
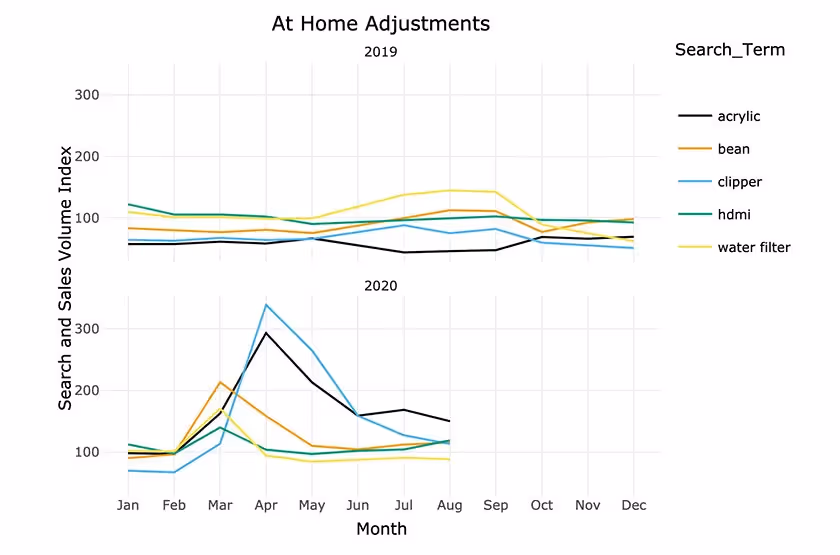
Haircare wasn’t the only category to see increased demand. Another product consumers bought in droves was acrylic nail sets. April numbers show the demand for acrylics went up 400% YoY.
3. The Comfort Buying Phase
April dragged on to May which dragged on to May Part II which dragged on to July, and the boredom phase made way for the comfort buying stage when what we thought would be a sprint became a marathon.
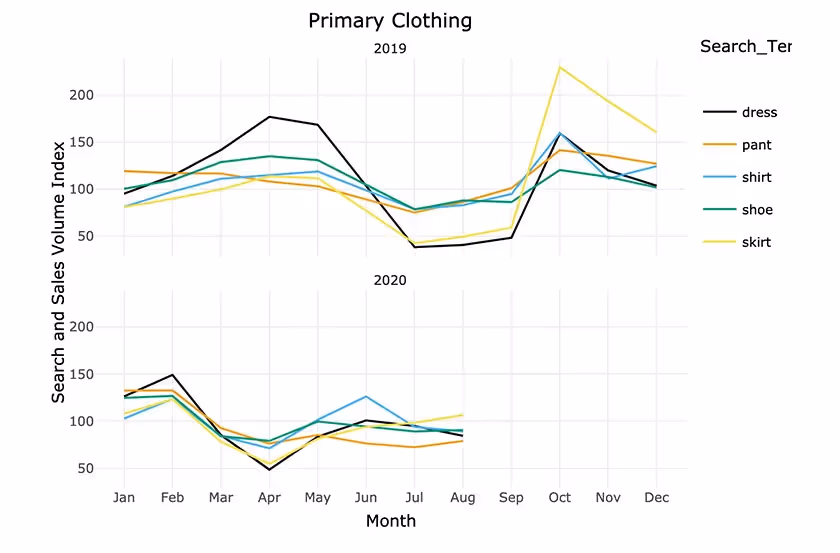
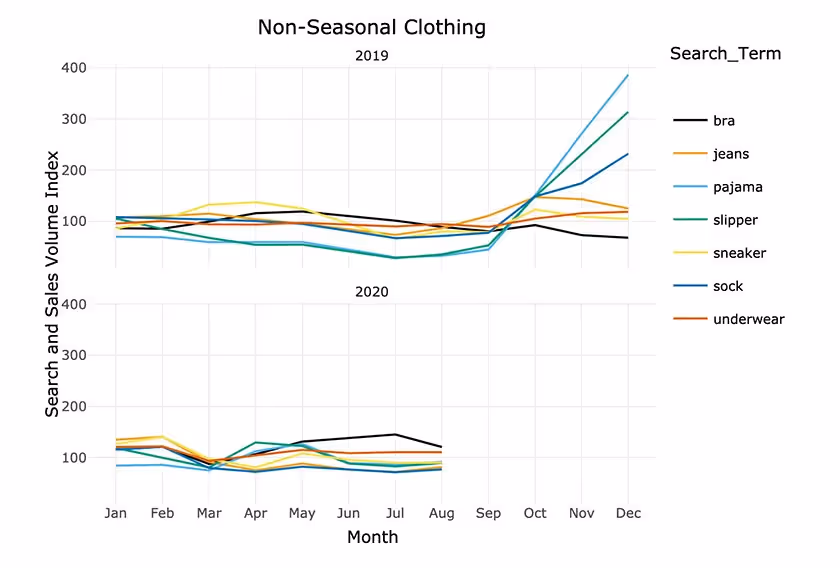
As the number of Zoom conference calls went up, the demand for pants tumbled down. Shirts have proven to be the best-selling clothing item in the era of remote work—above-the-waist fashion saw a post-lockdown climb. As more and more employees were allowed to work from home in March and April, the demand for coffee-related items also increased. Pajamas and slippers saw a spike in April and May as we got more comfortable with the great indoors. Their sales have held fairly steady while sales for outdoors-related clothing have fizzled. Bras and underwear have also been standouts during this phase—July 2020 numbers for bras coasted above 2019 numbers.
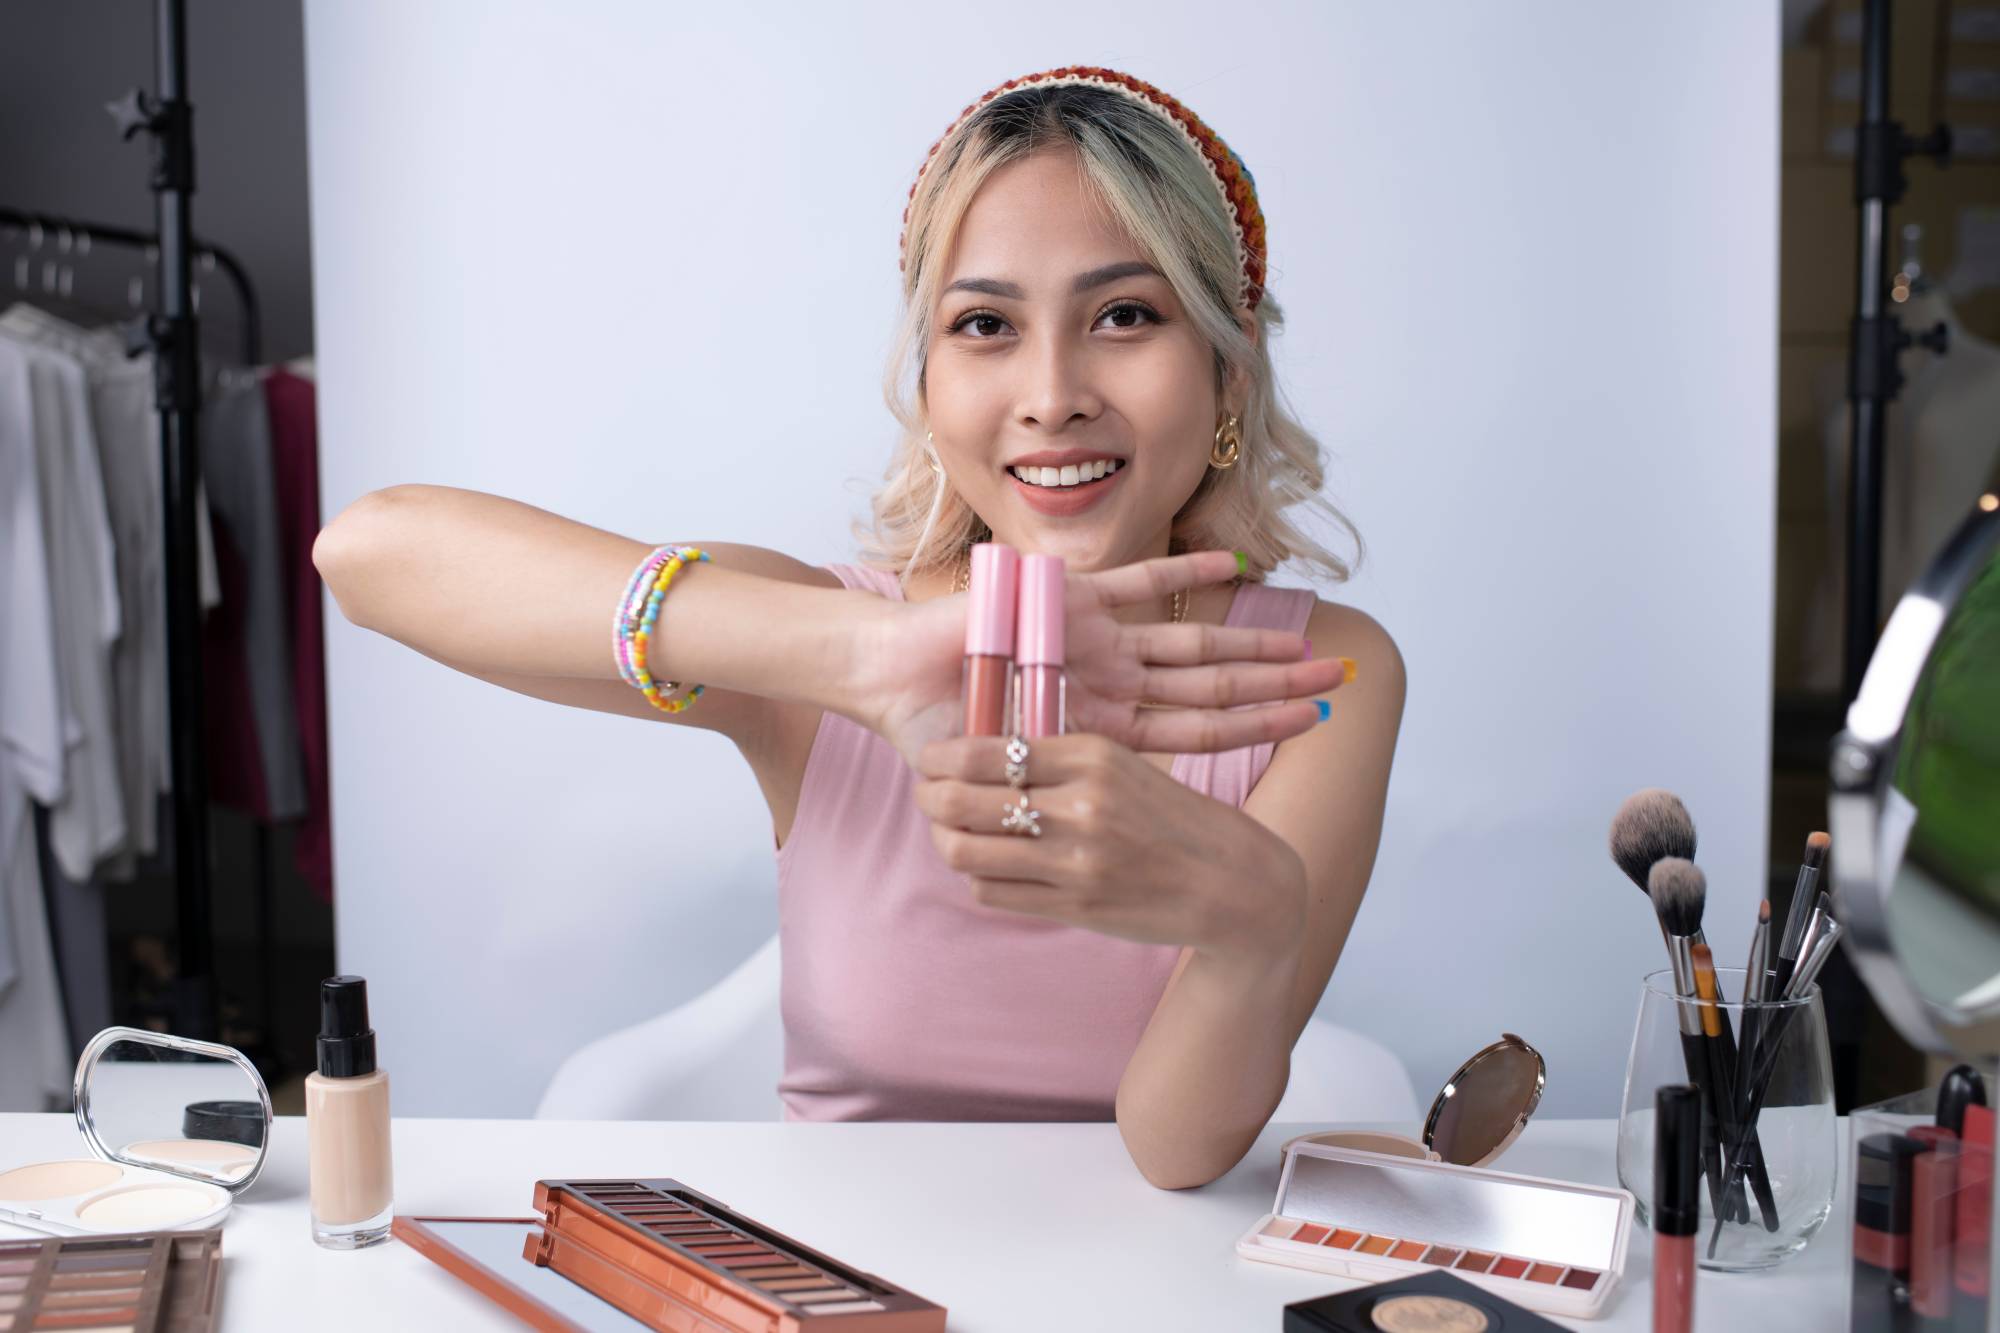
With less opportunities to go out and less people to dress up for, makeup sales took a tumble across most categories. One of the weird exceptions is lip care. Consumers traded their lipstick tubes for lip gloss in record numbers—lip gloss sales went up almost 400% in July, paralleling the rise of reusable mask purchases. This could be because lip gloss is a quick way to elevate your Zoom meeting look that doesn’t rub off or stain masks. This phase of the COVID-19 pandemic is also the phase when consumers started making more coping-related purchases to deal with the emotional and mental stress of lockdowns, job loss, health fears, and recession, some of them healthier than others.
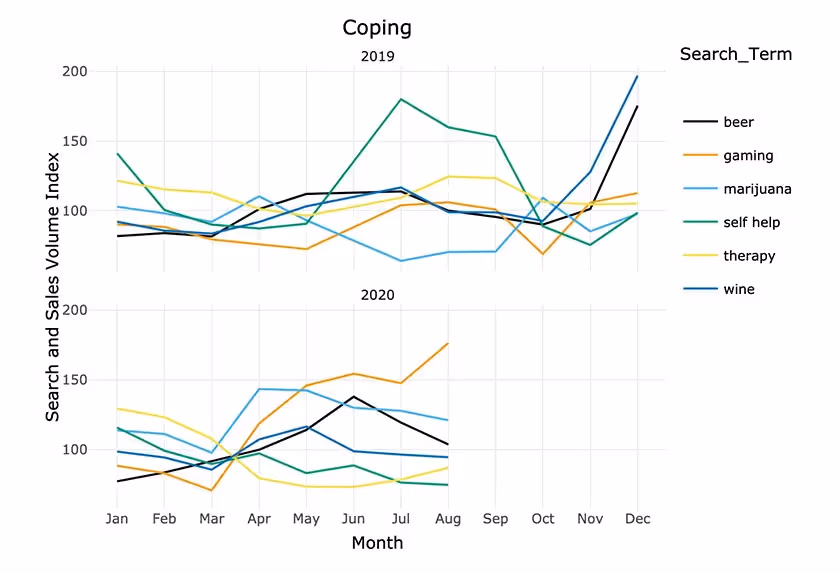
While divorce and therapy-related purchases dropped in March—this is fairly typical in recession environments—marijuana and wine sales spiked (you doing okay, America?). Come June and July, consumers were ditching self-help services and buying more beer and gaming related items. Gaming sales continue to increase in record numbers as we move closer toward what may be the most interesting holiday season we’ve ever had. In summary, 2020 has thrown a wrench in consumer buying habits.
Brands who have diversified are thriving, some have been downright unlucky (Looking at you, travel.), and some have hit the jackpot (Puzzles! Who would have thought.). At Pattern, we analyze consumer data like this to help our brands stay on top of ecommerce trends and succeed on ecommerce. To learn more about ecommerce trends in the time of COVID-19, explore our blog or contact us below to schedule a demo.