

.avif)


Amazon Revenue Scorecard: The Data Brands Need to Succeed on Amazon
The Amazon Revenue Scorecard provides a powerful way to assess how your ecommerce strategies are performing relative to your competition and where brands can optimize to maximize their Amazon revenue.
https://youtu.be/TgxBM5FCGE8
How do you rank on Amazon? Find out now.
For far too long, brands have lacked a data-driven methodology to gauge the health of their ecommerce presence relative to their competitors. As the top ecommerce accelerator, Pattern knew its proprietary technology and data could solve this for brands, so we leveraged our AI, rich Amazon seller information, and millions of cross-category data-driven insights to provide all brands with the information they need to succeed on Amazon and beyond.
The result—the Amazon Revenue Scorecard. The scorecard provides a powerful way for leaders to simply and transparently assess how their ecommerce strategies are performing relative to their competition and where they can optimize to maximize their brand’s ecommerce revenue potential.
What an Amazon Revenue Scorecard Measures
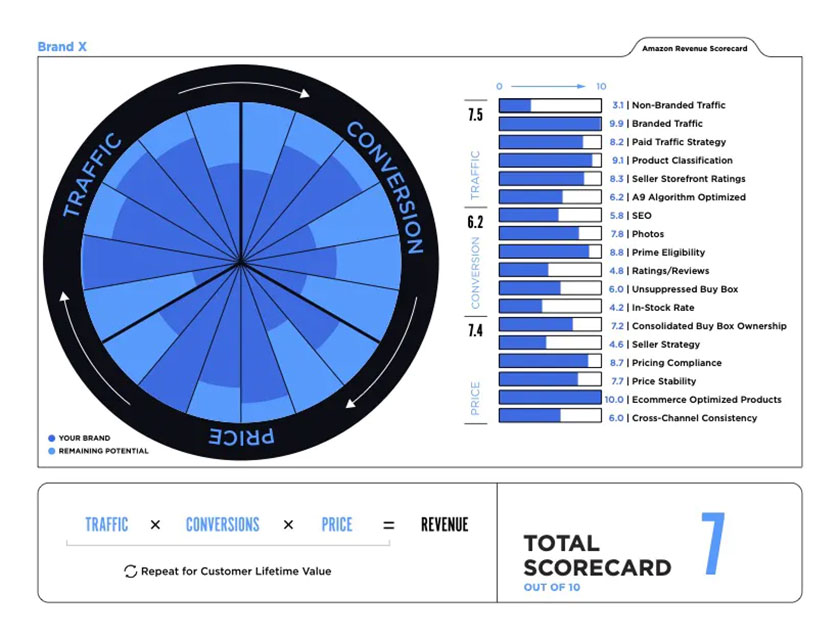
The Amazon Revenue Scorecard was developed by Pattern’s data scientists to holistically measure the ecommerce performance of a brand’s top products across three key drivers—traffic, conversion, and price—and 18 dimensions that impact a brand’s ecommerce revenue growth. The result is a score from 1-10 that helps brands in an ever-increasing array of industries measure their performance relative to their competitors. Strategically, an Amazon Revenue Scorecard is a rating index that provides real-time data to highlight missed revenue growth opportunities.
Why an Amazon Revenue Scorecard Matters to Executives
An Amazon Revenue Scorecard analyzes your top 25 ASINs to identify strengths, weaknesses, and gaps in revenue growth potential on ecommerce marketplaces. With a rank score of 1-10 in each revenue performance metric, it helps you understand the full picture—identify problem areas quickly and lean in on strengths. The higher the score, the more revenue you’ll generate on an ecommerce marketplace.
The key levers in the score are traffic, conversion, and price, which are the key variables in the ecommerce equation for all brands. As the top ecommerce accelerator, Pattern knows that the ecommerce equation (traffic x conversion x availability x price = revenue) is essential for brands to succeed on ecommerce. Therefore, it is imperative that brands continue to monitor the health of each input in order to have long term success.
Here we breakdown the three key drivers of a brand’s scorecard:
Traffic: Evaluate Marketplace Ecommerce Traffic
Traffic is the first strategic lever to drive revenue on marketplaces. Without generating more ecommerce traffic to your listings, you don’t have a hope of increasing marketplace revenue. A traffic score breaks down and rates your ecommerce traffic in the following key areas:
- Paid Traffic — the effectiveness of a brand’s advertising efforts, including keyword strategy, ad programs, and ad tactics
- Organic Traffic — how well a brand is capturing organic traffic within its category
- Marketplace Coverage — how many global marketplaces (Amazon, eBay, Walmart, etc.) a brand’s products are being sold in
Conversion: Calculate Conversion Opportunities on Marketplaces
Conversion is the second strategic lever to drive revenue on marketplaces. Once potential buyers interact with your product, they have to be compelled to convert on the listing. The conversion score breaks down and rates your marketplace conversion into five key areas:
- Listing Titles, Bullets, and Description — the degree to which a brand is utilizing best practices for titles, bullet points, and descriptions
- Listing Images and Videos — how well a brand is using high-quality and optimized multimedia to convey product features and benefits
- Content — how well a brand is conveying its voice and branding across the marketplace
- Ratings & Reviews — how well a brand’s products are being accepted by marketplace shoppers according to ratings and reviews
- Competitiveness — the degree to which a brand effectively utilizes promotional elements on its product pages
Price: Monitor Price Across Marketplaces and Sellers
Pricing is the third strategic lever to drive revenue on marketplaces. Without consistent pricing across marketplaces and sellers, your profits will steadily erode and you’ll have a hard time winning the Buy Box on Amazon and other marketplaces. The price score breaks down and rates your ecommerce price into four key areas:
- Channel Conflict — the likelihood that an online marketplace will undercut a brand’s brick and mortar retail partners on other platforms and channels
- Number of Sellers— the number of unique entities selling a brand’s products on a given marketplace
- Product Compliance — a measure of the stability of the price of a brand’s products on a given marketplace
- Cross-Channel Consistency — an assessment of the price consistency of a brand’s products across ecommerce marketplaces and D2C websites
Don’t leave your share of the global ecommerce market to chance—analyze ASIN and competitor performance now.
Pattern Helps Brand Accelerate Beyond Competitors on Amazon and Other Ecommerce Marketplaces
The Amazon Revenue Scorecard has been an integral and exclusive part of Pattern’s offering to its partners and is now available for all brands to assess their success on ecommerce marketplaces like Amazon. The standard is a measurement of the key drivers that impact revenue growth and it matters to brands since you need to see where your missed opportunities are and where your competition is outranking you.
Pattern can break down your brand’s revenue score on Amazon so you can command the maximum share of the exploding $6 trillion ecommerce market.
Executives interested in receiving your brand’s Scorecard can do so here.
Surprised by your score? Contact Pattern today and we will dive into the data.
.jpg)